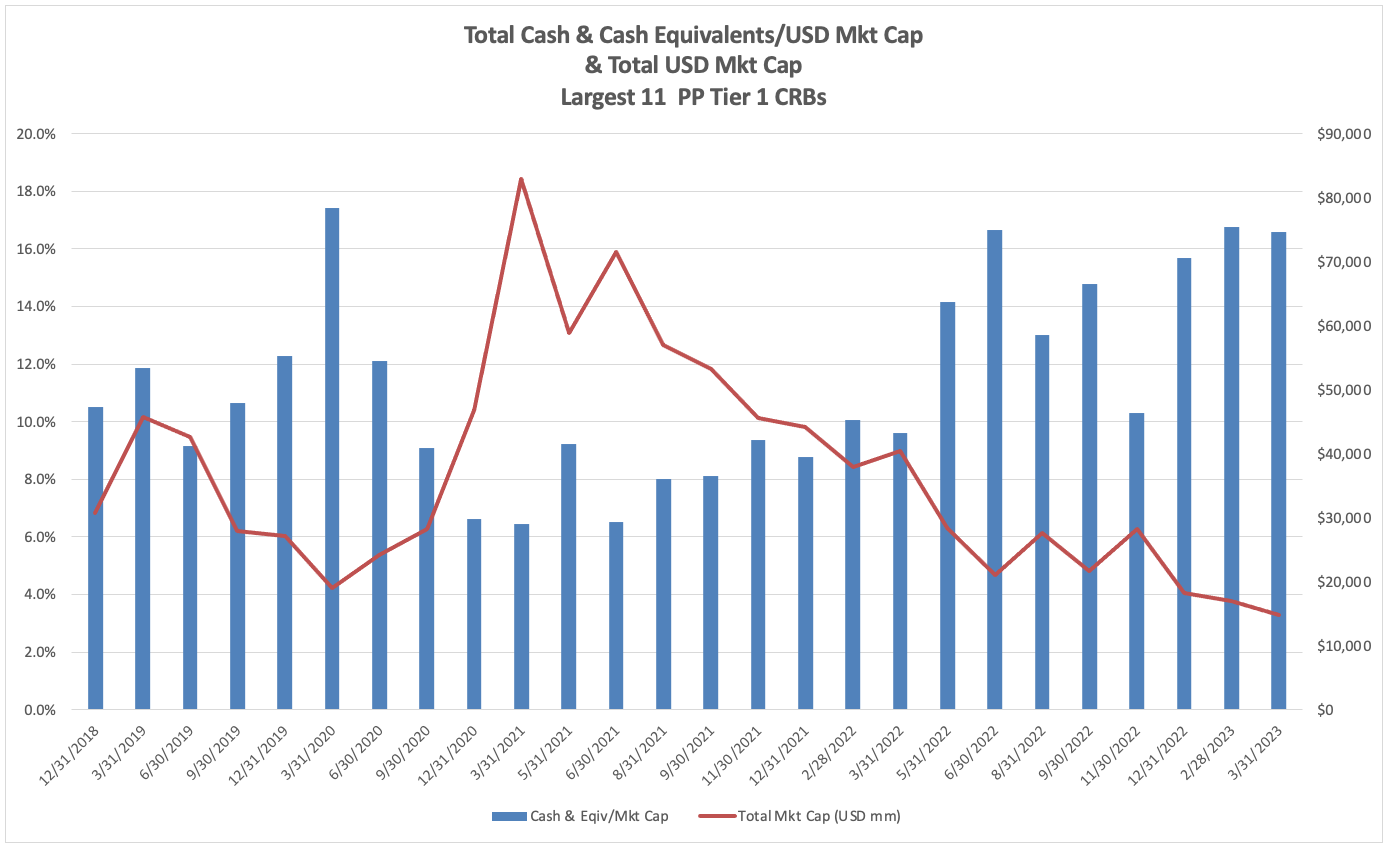
CRB Monitor Chart of the Month: Cash & Cash Equivalents
James B. Francis, CFA
Chief Research Officer, CRB Monitor
After a brief respite last month where we served up some interesting returns of digital asset-related businesses (DARBs), we return to cannabis and an interesting analysis of the balance sheet item Cash and Cash Equivalents, which is well-defined as follows by Investopedia.com:
- "Cash and cash equivalents refers to the line item on the balance sheet that reports the value of a company's assets that are cash or can be converted into cash immediately.
- Cash equivalents include bank accounts and marketable securities such as commercial paper and short-term government bonds.
- Cash equivalents should have maturities of three months or less.
- Cash equivalents must also be able to be liquidated to cash; for this reason, cash equivalents often have active markets.
- A company carries cash and cash equivalents to pay its short-term bills but to also preserve capital for long-term capital deployment."
The chart below highlights the precipitous decline over the recent 4+ year period in the total market cap of the largest publicly-traded cannabis-related companies (as indicated by the red line); and the trend in Cash & Cash Equivalents over total market cap over the same period (the blue bars). The February 2021 spike is related to the “Gamestop” effect that was pervasive at that time. As the chart shows, as the total market cap went into its downward spiral, companies’ percentages in cash were rising and staying high. [As a comparison Tier 3 CRB Amazon.com, Inc. (Nasdaq: AMZN)’s average quarterly percentage Cash & Cash Equivalents of Total Market Cap since 2001 is 4.3% [1]. Microsoft Corp (Nasdaq: MSFT)’s average since 2001 is 2.3%.] [2]
 Source: CRB Monitor, Sentieo
Is such a high ratio of C&CE/MCAP a good thing? Given that this is, in essence, a measure of liquidity, it should give investors some level of comfort when a CRB maintains this percentage above 15% of market cap. It shows that these companies are, by and large, risk-averse as they hunker down waiting for legalization. On the other hand, companies that maintain this level of liquidity/risk aversion might be hamstrung as they attempt to carry out a growth strategy. We will wait and see, but the scary red line will have difficulty turning around without meaningful progress toward US legalization.
Wondering what a Tier 1, Tier 2 or Tier 3 CRB is?
See our seminal ACAMS Today white paper Defining "Marijuana-Related Business" and its update Defining "Cannabis-Related Business"