James B. Francis, CFA
Chief Research Officer, CRB Monitor
As cannabis equities continue their prolonged fall from grace (down more 50% YTD), investors who held onto their shares wonder why they are doing so while those who bailed out try to figure out when it’s safe to get back in. Spoiler alert: there are no answers to those questions here!
Rather, we are looking for an answer to the question above, specifically: what factors, if any, contribute to cannabis returns, or alternatively, which factors and/or sectors behave the most like cannabis equities? And while there is no definitive answer to this question, we might be able to pave the way to future exploration into one of our latest emerging markets, cannabis equities.
Non-Investment Forces in the Market
In a perfect world, publicly-traded cannabis companies would be engaged in operations that represent what they do best: there would be cultivators that sell to manufacturers/processors, who in turn wholesale to retailers, who then sell to consumers. But due to federal regulations, many CRBs are “vertically integrated”, meaning that they engage in (and are licensed for) several, if not all, stages of cannabis production.
For example, Canopy Growth Corp. (TSX: WEED) holds, largely through its Canadian subsidiary businesses, nearly 100 government-issued licenses that span the process from cultivation to manufacturing, to transportation, then to retail. A similar example is US-based multi-state operator Verano Holding Corp. (CSE: VRNO), which operates in 19 states and through its subsidiary businesses holds more than 80 licenses that allow them to cultivate, process, and retail cannabis products. US Federal laws prohibit Canadian CRBs like Canopy Growth to sell their products in the US while also prohibiting companies like Verano to move product across state lines. It’s this regulatory-based inefficiency that can stifle profitability, as CRBs must resort to suboptimal strategies as they await legislation that, ultimately would allow them to leverage their real strengths.
There are two additional, impactful factors that are unique to the cannabis industry:
The first is the progress, or lack thereof, toward any form of cannabis legalization at the federal level. Without this legislation, cannabis companies’ valuations will likely remain where they are and the industry will face consolidation and several companies will likely bail out of the industry. We have written about this extensively in our CRB Monitor monthly securities newsletters, the latest of which can be found here.
The second factor is the ongoing, unfair competition from the Illicit market. Given its pricing advantages due to the absence of taxation or government regulations, combined with inadequate law enforcement, the illicit market has thrived in recent years. An interesting expose on the illicit cannabis market in California can be found in this article from our friends at La Jolla. The strength of the illicit market on the legal cannabis industry varies by affected state, and we have seen its market share estimated as low as 10% or as high as 50% of the total cannabis market, depending on the state.
Question: Given all of this incidental, non-market-related noise contributing to cannabis equity returns, is it possible to find any “normal” factors that drive their historical performance?
While this is not intended to be a seminal piece on the cannabis factor attribution, it is refreshing to see that, in spite of the obvious “noise” in the data, we are encouraged that the correlations to certain factor- and sector-based were what we might expect, even in this world of uncertainty.
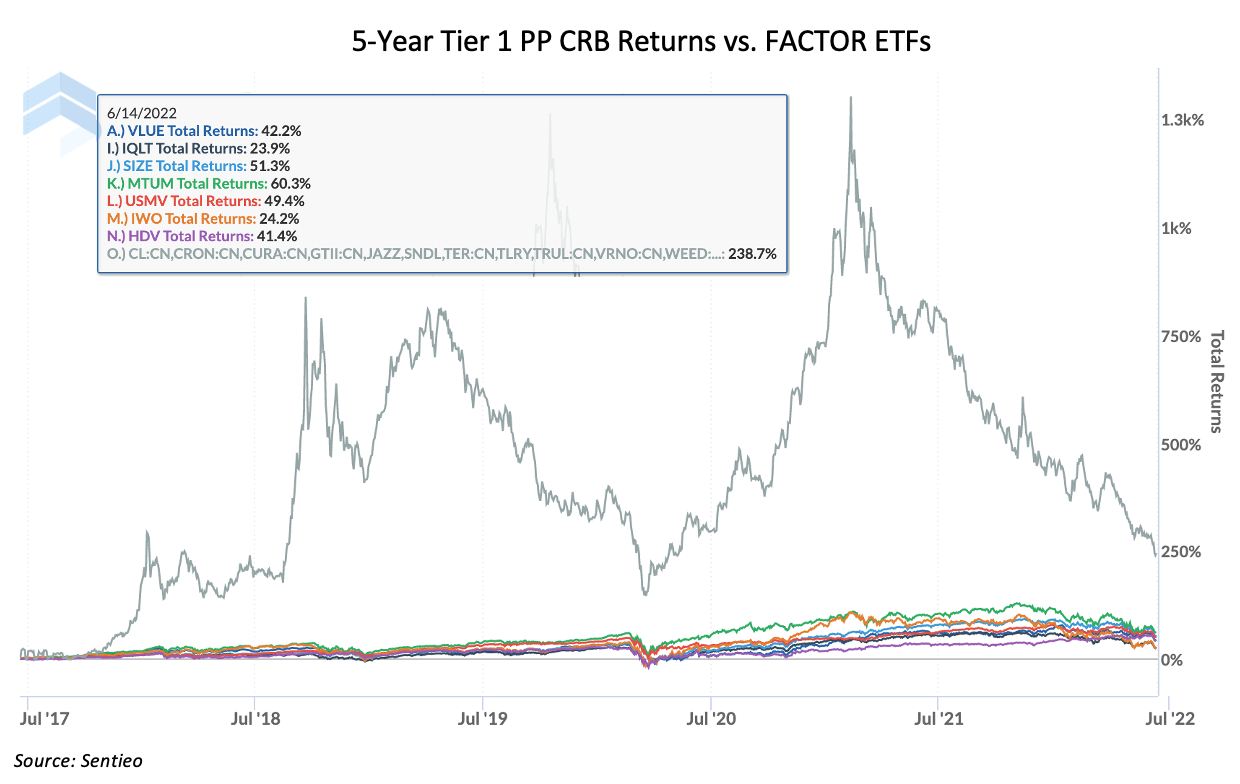
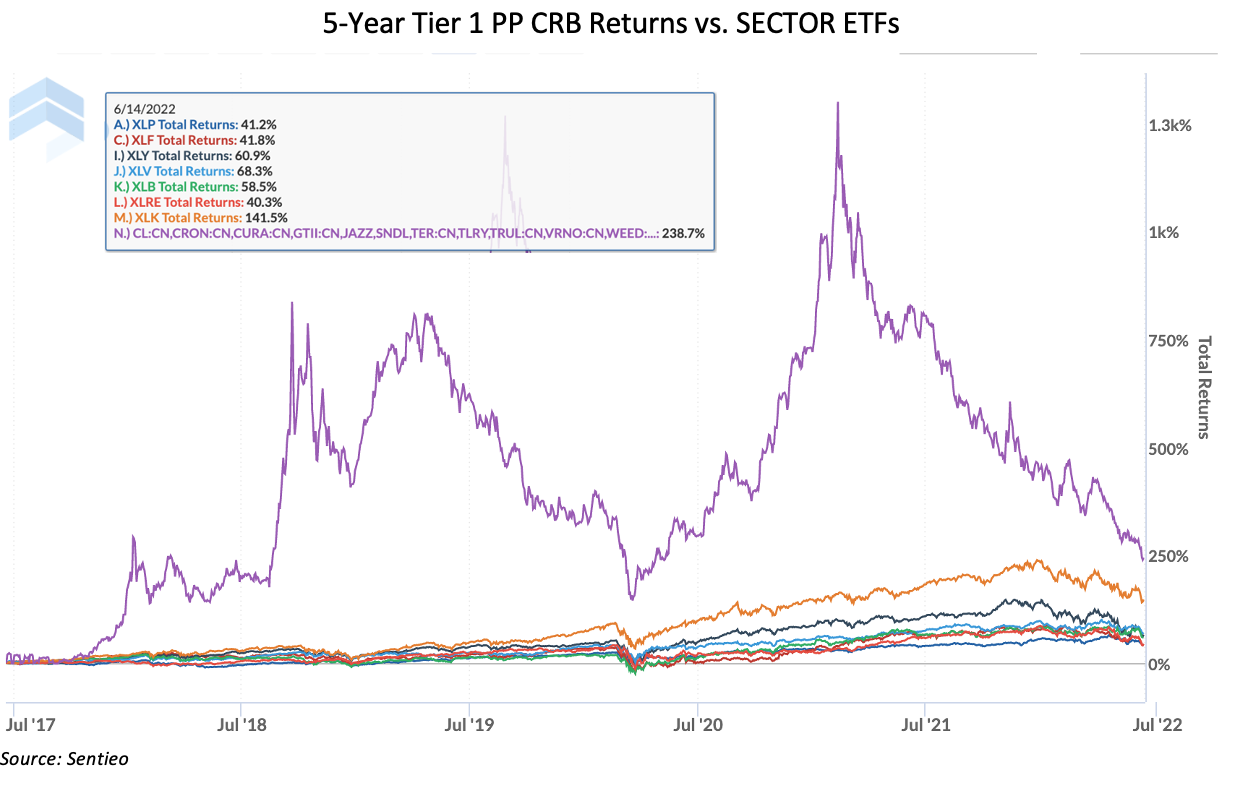
It is important to note that we will not be so presumptuous at this time as to make any bold statements about true factor attribution. Instead, as an exercise in curiosity, we present the 5-year returns of a Tier 1, pure play cannabis basket and compare it first to several factor-themed ETFs, then to several sector-themed ETFs.
We will look at the performance charts, which don’t tell us too much, then correlations, which tend to be more interesting.

From the chart above, we can see that cannabis returns are wildly volatile, and are certainly period-dependent. An investment in this Tier 1 basket 2017 would yield a 238% return if the investor held on through June 2022. That is a major success compared to any of the factor-based ETFs above. Of course, if the investor first bough cannabis equities a little over a year later in 2018, their return would be negative.

Cannabis equity performance vs. several sector ETFs (see above) looks very similar to the factor chart and just like that chart, it’s not so full of information for us. In fact, from either of these charts one might believe that there is no relationship between cannabis and any of these factors or sectors.
But wait! There is a ray of hope when we take a look at the factor correlations below. Recall that the above market forces unique to cannabis (stalled legalization, illicit market, heavy regulations) are likely to cause some degree of noise in cannabis equity returns. With that said, there is some good news!
Factor Correlations - 5 Years

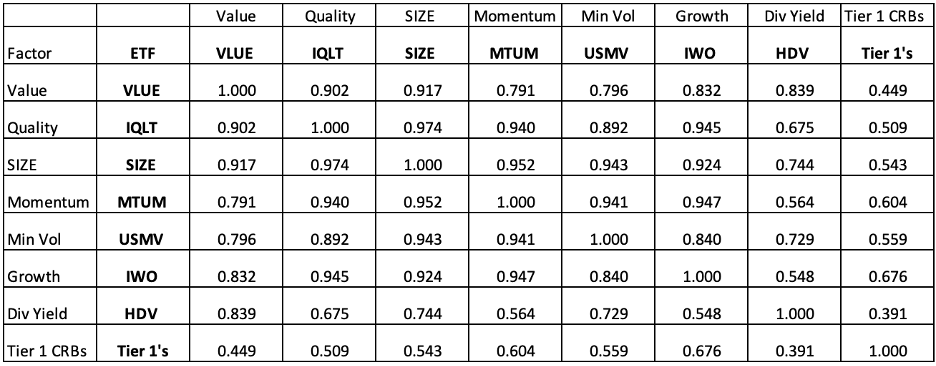
What does these correlation tables tell us? One surprise for us is that correlations between and among these factor funds (not cannabis) are rather high (check out Value/Growth at 0.832). [Please note that a deeper dive into those correlations are for another report, most likely not written by us.]
What we do find interesting, however, is the dispersion of correlations between pure play cannabis and these common factor ETFs. And the burning question is: are cannabis equities more highly correlated to the factors we would expect them to be? Let’s find out!
Not surprisingly, the lowest correlation (0.391) is with the High Dividend Yield ETF. This is most likely because Tier 1 pure play CRBs tend to pay zero dividends. The fact that it is a number above zero suggests that there are other factors at play (which we already knew from above). The highest correlation relative to Tier 1 is the Growth ETF (0.676), which confirms what we should all think about cannabis, that it is first and foremost a growth industry. Also somewhat high is the correlation with the Momentum ETF (0.604). This is also not surprising, given that cannabis equities tend to trend, both positive and negative, for extended periods of time, which is the definition of momentum.
Sector ETF Correlations - 5 Years

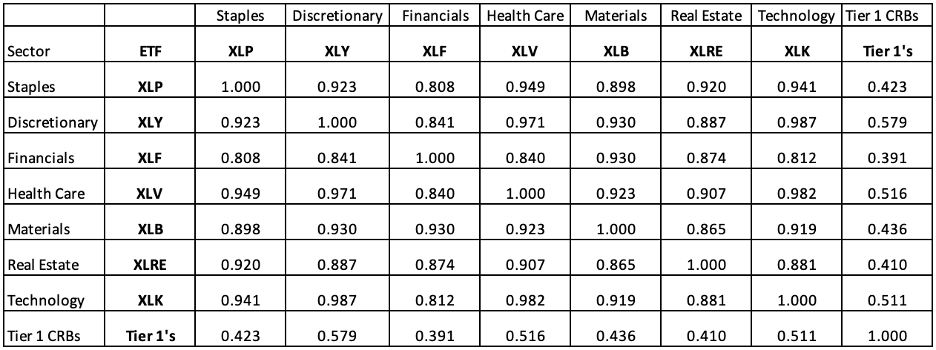
As with the factor ETFs above, sector ETFs (based on GICS methodology) exhibit high correlation with one another. With that said, there is reasonable dispersion across their correlations with cannabis equities. We see the highest correlations with Consumer Discretionary (.579), Health Care (.516), and Technology (.511). The first two were expected, given the aspects of recreational and medical cannabis. Technology is certainly a relationship to ponder further; however, one can make the connection given the higher correlation to growth stocks (as seen above).
As the “gold standard” for cannabis market intelligence, CRB Monitor has its finger on the pulse of the entire cannabis ecosystem. We perform deep research on more than 60,000 cannabis-related businesses (CRBs), including a global universe of more than 1,400 public cannabis-related companies.
Wondering what a Tier 1, Tier 2 or Tier 3 CRB is?
See our seminal ACAMS Today white paper Defining "Marijuana-Related Business" and its update Defining "Cannabis-Related Business"