CRB Monitor Chart of the Month: Debt Ratio
James B. Francis, CFA
Chief Research Officer, CRB Monitor
This month we take a look at the balance sheet once again, as our fascination continues when it comes to managing the financials for a business that is technically illegal. Add to that a business that (in the eyes of the stock market) appears to be collapsing with every new performance period and you have unlimited discussion topics. And so we look at the ratio of Liabilities to Assets, also known as the Debt Ratio. For companies that are struggling, the trend in the Debt Ratio is a key indicator, as in the words of Investopedia.com:
- A debt ratio measures the amount of leverage used by a company in terms of total debt to total assets.
- This ratio varies widely across industries, such that capital-intensive businesses tend to have much higher debt ratios than others.
- A company's debt ratio can be calculated by dividing total debt by total assets.
- A debt ratio of greater than 1.0 or 100% means a company has more debt than assets while a debt ratio of less than 100% indicates that a company has more assets than debt.
 Source: CRB Monitor, Sentieo
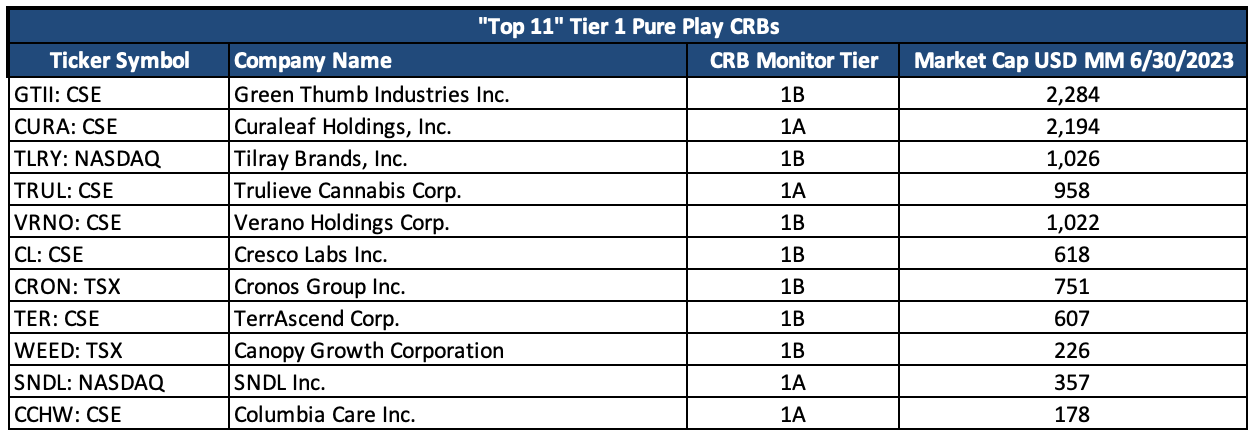
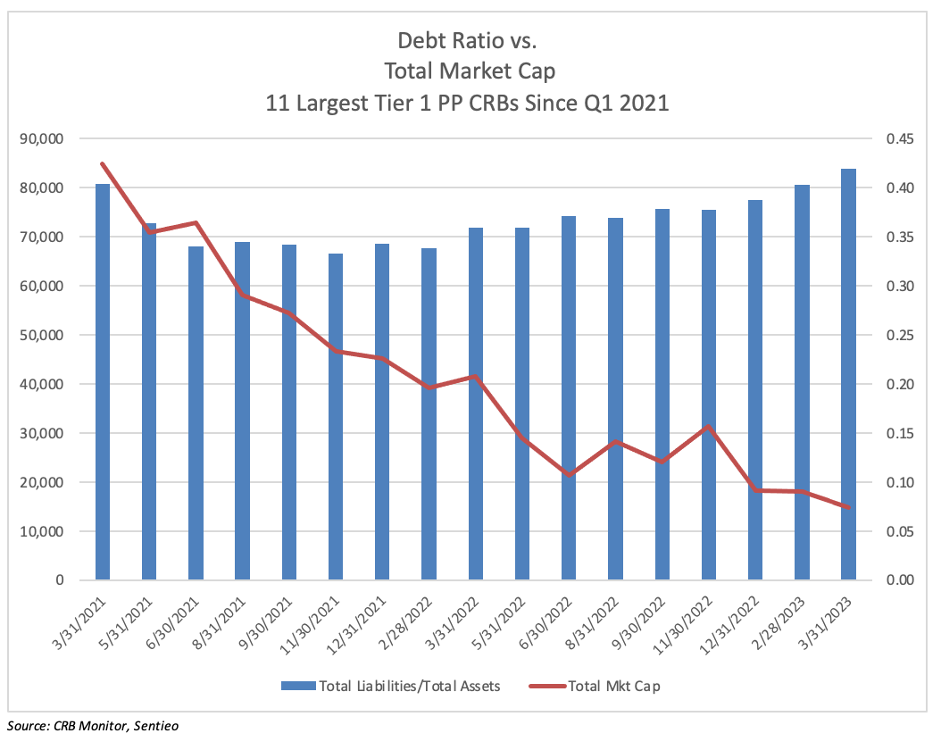
The chart below highlights the dramatic, even breathtaking drop over the recent 2-year period in the total market cap of the 11 largest publicly-traded Tier 1 Pure Play cannabis-related companies (please see the table above and they are indicated by the red line on the chart below); and the trend in the aggregate Debt Ratio of those same 11 CRBs over total market cap of the 11 over the same period (the blue bars). The Debt Ratio varies across these companies, but for this exercise we are using the aggregate, given that they are essentially in the same business which has been hamstrung by the slow crawl toward US legalization for the same period of time.
We see that over the last two years, and more recently while Rome has been burning, the debt ratio hit its high of 0.42. [As a comparison Tier 3 CRB Amazon.com, Inc. (Nasdaq: AMZN)’s Debt to Asset ratio for 12/31/2022 was 0.19 as reported by Stock Analysis On Net. Microsoft Corp (Nasdaq: MSFT)’s is 0.18, reported by the same source.]

Similar to last month’s chart which looked at Cash and Cash Equivalents, this ratio is another interesting measure of liquidity, which should give us some insight into the viability of not just these household-name companies, but for the cannabis industry as a whole. Does this trend look healthy, as the debt ratio hits its two-year high of 0.42? This will be interesting going forward, with interest rates already frothy and the Fed projecting two near-term interest rate increases. It is anybody’s guess if these CRBs can sustain an industry-wide debt ratio of over 0.5, but we shall see. And it bears repeating that the legal cannabis industry currently employs more than 400,000 workers, so it is here to stay for years to come, in some form.
CRB Monitor is a comprehensive, global database of over 1,700 listed cannabis-related securities, 75,000 private cannabis-related businesses, 199,000 cannabis licenses, and 130,000 individuals with connections to the cannabis space. Our goal is to provide our clients with 100% of the private and publicly-traded global cannabis ecosystem and our subscribers include many of the largest financial institutions worldwide.
Wondering what a Tier 1, Tier 2 or Tier 3 CRB is?
See our seminal ACAMS Today white paper Defining "Marijuana-Related Business" and its update Defining "Cannabis-Related Business"